


Data
Data Blog: Commercial terrain data set
This data set consists of 369 pieces of land that are described as business terrain, scattered through the province of North Holland, which mean from Alkmaar to Amsterdam including some in West Friesland, Zuid Kennermerland, Ijmond and Het Gooi and Vechtstreek. Most of you not living in the Netherlands will know most of these places. The land may or may not currently be in use. There are 60 fields to each entry containing information on size of the land, projects the land is part of and it’s general condition, with links to owners. You can see the full list at the bottom of this post.
Some land may be available for redevelopment for temporary purpose or for ‘pop-up’ activities of the commercial or cultural sort. Amsterdam City Council (Gemeente Amsterdam) recently released a map of unused business areas including links to local officials who you are encouraged to contact should have an idea of how to reuse the space. For the record, the situation is dire here in the Netherlands. There are currently 7,6 million square meters of empty office space and that is not including business terrain (land without any buildings on it) which is also a largely underused and undeveloped resource. This situation was partly created by Dutch city councils giving away too much land for development, resulting in too many offices being built is various areas of the country combined with an economic recession. I recently presented a talk on this topic at Cognitive Cities Salon in Amsterdam, while proposing we look into finding solutions for this literal waste of space and can perhaps benefit by making these places searchable and perhaps configurable.
Data exploration
I downloaded the dataset for business terrain areas in the province of Noord Holland, importing the csv file into a Google spreadsheet which was relatively easy. For the import to work, i had to specify how each data field was separated in the .csv file used it used semi-colon rather than the more familiar comma. With this done, Google Fusion Tables imported the spreadsheet for some preliminary data testing. Here’s a link to the file inside google docs to see what it looks like at this stage and here’s where it is on Fusion Tables.
Next i started to play with the data to get more of an understanding by creating some ‘Pie Charts’, ‘Intensity’ and ‘Scatter’ maps to show correlations between different fields.
pie chart of listings per gemeente
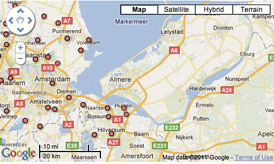
Location of business terrains across Provincie North Holland
There are rather a lot of fields available per each record of data entry, around 60!
Name Region
Name of city council
Name of center
Business terrain name
Name of location
Also known under another name
Type of location
Website contact person in city council
Website contact person for sales
Rin number location (some kind of generic ID number)
Owner of the land
Segment of the business terrain
Primary target group (not sure who this is referring to)
Kavelgrootte
Environmental Zoning
Sustainability Conditions
Toelichting duurzaamheidsmaatregelen
Maximal environmental category (no clue what this means)
Traffic intensity (How many traffic jams on nearby roads)
Distance to the motorway/freeway
Functional merging (Functiemenging – must be translating this poorly)
Open Open invoer functiemenging
Phase of planning
Airport connection
Park management present?
Is the business terrain completely allocated?
Bruto hectares of business terrain 1 january
Information on changes to bruto business area terrain
Netto hectares of business terrain 1 january
Netto hectares of business terrain allocated january 1st
Netto ectares of business terrain allocated last year
Repurchased land in hectares under council ownership 1 january
Total available for giving out/allocation by january 1st
Total available for allocation to businesses january 1st
Totaal terstond uitgeefbaar gemeente 1 januari jl. in ha
Totaal terstond uitgeefbaar particulier 1 januari jl. in ha
Totaal niet terstond uitgeefbaar gemeente 1 januari jl. in ha
Totaal niet terstond uitgeefbaar particulier 1 januari jl. in ha
Netto oppervlakte (in ha) van het grootste aaneengesloten uitgeefbaar deel
Datum/jaartal waarop de eerste kavel van de werklocatie verkocht is
Hoeveelheid in optie uitgegeven per 1 januari in ha
Is the work location next to the street or connected to platform (railway)?
Is the work location next to the street or connected to water?
Parking?
Is the work location aged/old?
What is the main reason for aging?
Bruto aged area in square hectares
Are their plans for refurbishment/renewal?
Type and omvang of the refurbishment/renewal
In which phase of refurbishment is the area in?
Omvang van het nieuw uitgeefbaar netto aanbod in ha,
Information on changes to bruto area in hectares squared.
Empty
Are there plans/ work on a transformation?
What is the omvang of the transformation?
In which phase is the area in of the transformation?
Which function is getting transformed?
This is just a preliminary scan of the data and it’s up to others out there how they might want to apply the data to gain insight or create new tools. Making this commercial terrain visible might be handy for people wanting to find use these spaces and get in touch with the owners. It also can make filtering of different properties easier to do. Perhaps someone will make an app similar to the city of Amsterdam one listed above. So this wraps up this commercial terrain data set post.
James Burke
Laatste berichten van James Burke (toon alles)
- Nederland van Boven - 12 februari 2012
- Data Blog: Commercial terrain data set - 1 augustus 2011
- Inzending: Dude! Where’s my car? - 9 mei 2011